
Solar vs storage: two competing forces
How solar and storage growth are changing daytime prices and solar capture.
More solar supply around midday tends to push daytime prices down and widen the gap to evening prices. Batteries can charge when prices are low and discharge later. The pace of solar, storage and flexible demand growth will help determine the price solar farms capture.
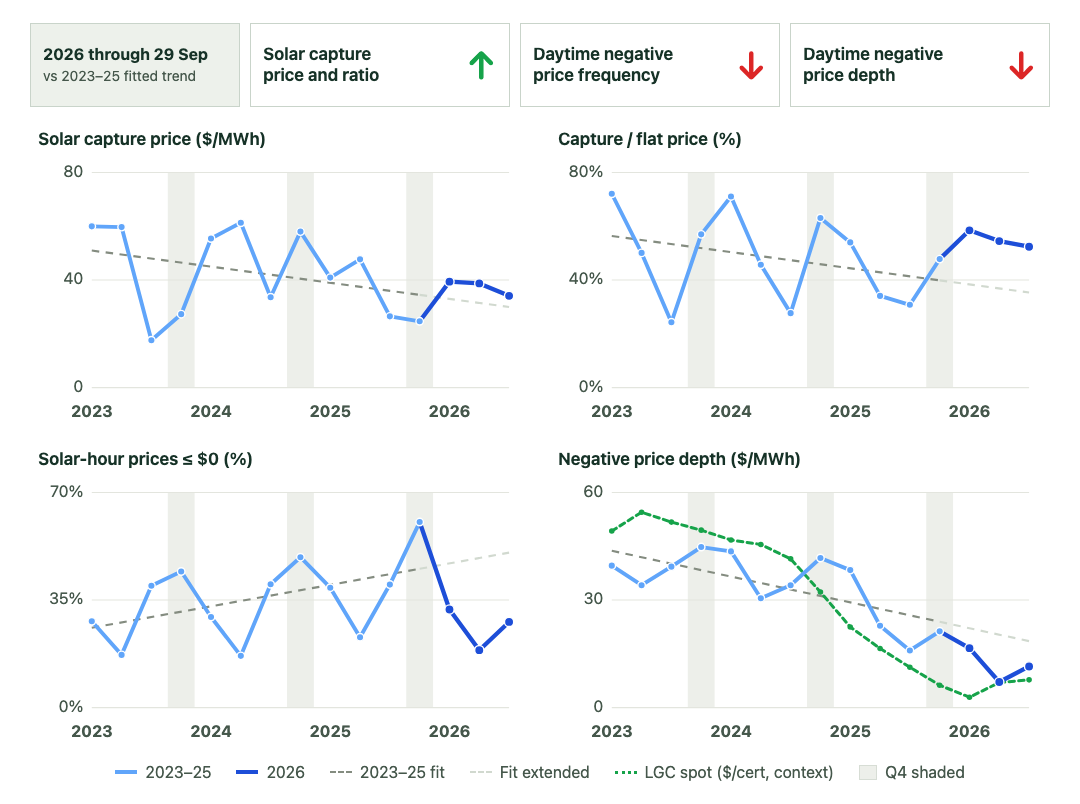
In 2026, solar's share of the flat price has risen against the 2023–25 trend. From 1 January to 29 September, mainland utility solar captured 55% of the average flat wholesale price, up from 38% over the same 2025 dates. Solar-hour prices at or below zero were less frequent in Q2, and negative prices were shallower.
The historical comparison begins in 2023. Capture prices cover dispatched utility solar in NSW, QLD, SA and VIC; the negative-price statistics cover all five NEM regions. The outlook uses AEMO's final 2026 Integrated System Plan Step Change scenario.
Solar is growing, and storage is catching up
Since 2023, registered battery power has grown faster than PV capacity, from a much smaller base. Distributed PV has also continued to grow. The Australian Government's Cheaper Home Batteries Program began in July 2025, around the time home battery registrations accelerated. The policy likely helped, but these snapshots cannot measure its share of the increase. They use different utility and distributed power bases; a September 2025 change to the DER data also limits year-on-year comparisons.
Solar PV capacity (GW)
Battery power (GW equivalent)
Growth since prior snapshot and total battery to solar power ratio (%)

The impact on daytime prices
The capture ratio rose from 38% to 55% for January to 29 September, even though the absolute capture price for that whole period was slightly lower: $37.5/MWh in 2026 versus $38.6/MWh in 2025. Flat prices fell faster. In Q3 alone, the absolute solar capture price rose from $26.5/MWh to $34.1/MWh. Across Q1–Q3, the 2026 points sit above a simple line fitted only to 2023–25 capture observations.
In Q2, prices at or below zero during solar hours fell from 22.9% to 18.7% of intervals year on year. Among strictly negative intervals, the mean price moved from −$22.8/MWh to −$7.1/MWh. We cannot say from these prices alone how much of the change came from battery charging. Q4 has historically brought more surplus solar and weaker daytime prices; Q4 2026 was still unobserved at this data cut-off.
Solar capture price ($/MWh)
Capture to flat price (%)
Solar-hour prices at or below $0 (%)
Negative price depth and LGC spot
Less available solar was left undispatched in Q3
Using five-minute AEMO dispatch records, the share of available mainland utility solar not dispatched fell from 18.8% in Q3 2025 to 12.4% in Q3 2026. Q1 and Q2 did not show the same year-on-year decline. Q4 was the high point in each of 2023, 2024 and 2025.
This measure is availability minus the dispatch target, divided by availability. It includes economic offloading, network constraints and differences between forecasts and dispatch targets. It is broader than AEMO's network-only curtailment measure and is not a metered estimate of lost generation.
Available solar not dispatched (%)

Will stronger capture rates persist?
In AEMO's Step Change pathway, average daily solar output remains roughly twice the fleet's theoretical six-hour charging limit from 2030. The ratio falls from 2.7 times in 2026–27 to 1.8 times in 2029–30, then sits near 2.2 times later in the pathway.
The charge limit is the lesser of each storage type's energy depth and its power multiplied by six hours, summed across types. Pumped hydro illustrates why nameplate energy alone can mislead: Snowy 2.0 has substantial storage depth, but its 2.2 GW charging power limits what it could absorb in six solar hours. Actual charging will also depend on where storage is built, its state of charge, dispatch and competing demand.
Daily solar output and storage (GWh)

What happens next?
If charging and daytime demand lag solar output, more generation may be curtailed. Q4 2026 will test whether stronger capture rates hold through the season with the most surplus solar. Can charging power and flexible demand keep pace with PV?
Sources and definitions
Capture price is the generation-weighted wholesale spot price of dispatched mainland utility solar; capture ratio divides it by the simple average of the four mainland regional flat prices. These are wholesale measures, before asset-specific costs, contracts, loss factors and LGC revenue. Solar hours for the negative-price series are 09:00–17:00 AEST, with five NEM regions equally weighted. Data end on 29 September 2026.
Historical prices and dispatch come from AEMO MMS data. Capacity uses CER small-scale installation data and AEMO's Generation Information and DER Register. The forward comparison uses AEMO's final 2026 ISP. AEMO distinguishes offloading from network curtailment; the dispatch-availability chart combines them. Its Q2 2026 result is close to the combined solar offloading and curtailment reported in AEMO's Quarterly Energy Dynamics.